- Sysmon user (domain, sid, name) were not consistent with security logs. |
||
|---|---|---|
| elasticsearch | ||
| enrichments | ||
| kibana | ||
| logstash | ||
| nginx | ||
| resources/images | ||
| scripts | ||
| spark | ||
| winlogbeat | ||
| .gitignore | ||
| Dockerfile | ||
| LICENSE | ||
| README.md | ||
| helk_install.sh | ||
README.md
HELK [Beta]
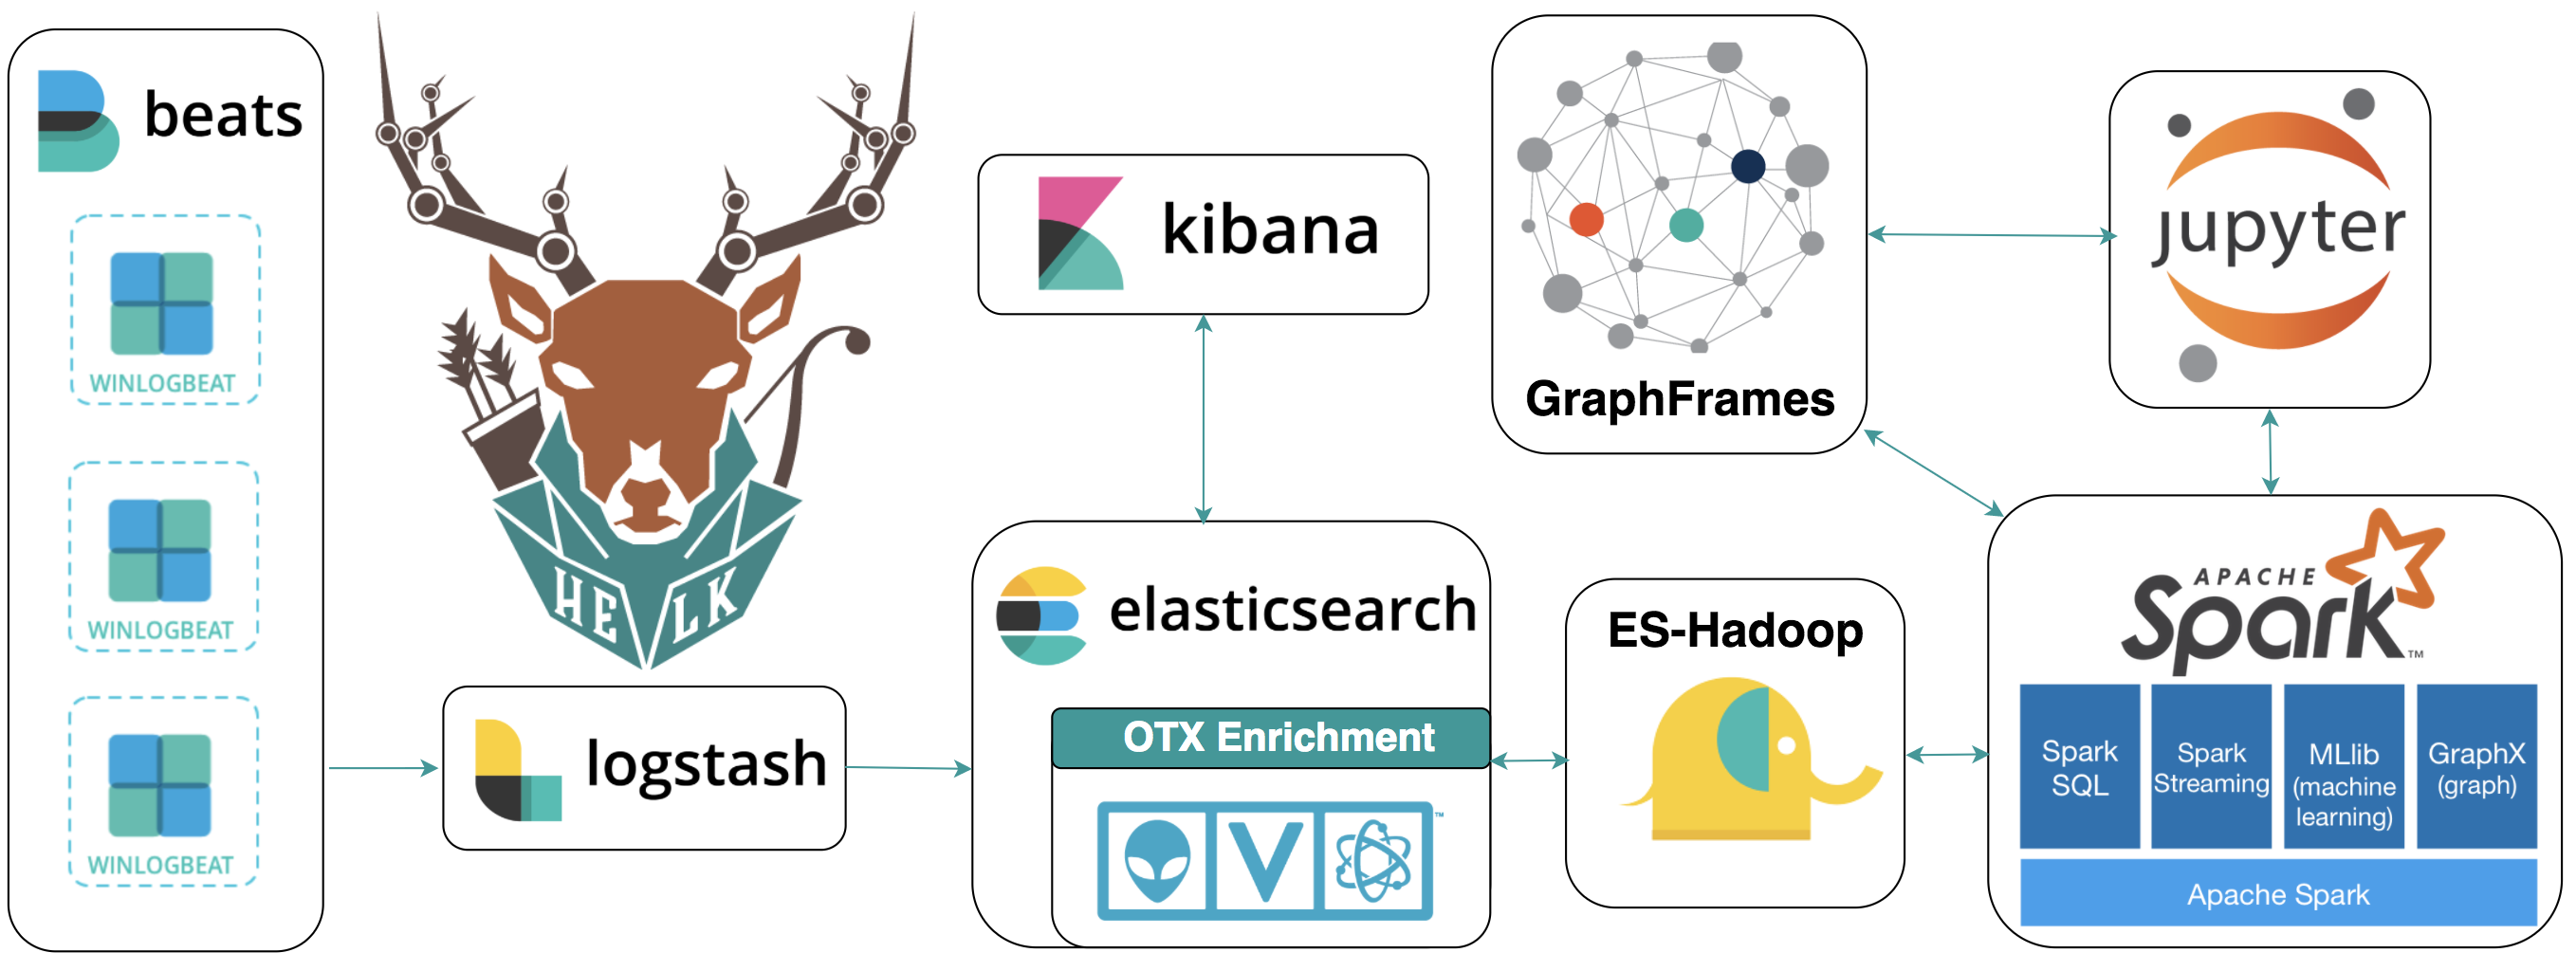
A Hunting ELK (Elasticsearch, Logstash, Kibana) with advanced analytic capabilities.
Goals
- Provide a free hunting platform to the community and share the basics of Threat Hunting.
- Make sense of a large amount of event logs and add more context to suspicious events during hunting.
- Expedite the time it takes to deploy an ELK stack.
- Improve the testing of hunting use cases in an easier and more affordable way.
- Enable Data Science via Apache Spark, GraphFrames & Jupyter Notebooks.
Resources
- Setting up a Pentesting.. I mean, a Threat Hunting Lab - Part 5
- An Integrated API for Mixing Graph and Relational Queries
- Graph queries in Spark SQL
- Graphframes Overview
- Elastic Producs
- Elasticsearch Guide
- spujadas elk-docker
- deviantony docker-elk
Getting Started
Requirements
- OS Name: Linux (Debian-based systems)
- Bash Script Option: Tested on Ubuntu-16.04.2 Server amd64 (Xenial)
- Network Connection: NAT or Bridge
- RAM: 4GB (minimum)
- Applications:
- Docker(Needed for HELK Docker Installation ONLY)
- Winlogbeat running on your endpoints (At least sending Sysmon and Windows Security event logs)
- HELK's current version parses logs shipped by Winlogbeat ONLY (Nxlog parsing is coming soon)
Automatic Installation Options
The HELK project comes with three options:
- Pulling the latest HELK Docker Image from cyb3rward0g dockerhub
- Building the HELK image from a local Dockerfile
- Installing the HELK from a local bash script
git clone https://github.com/Cyb3rWard0g/HELK.git
cd HELK/
sudo ./helk_install.sh

**********************************************
**           HELK - M E N U                 **
**                                          **
** Author: Roberto Rodriguez (@Cyb3rWard0g) **
** HELK build version: 0.9 (BETA)           **
** HELK ELK version: 6.x                    **
** License: BSD 3-Clause                    **
**********************************************

1. Pull the latest HELK image from DockerHub
2. Build the HELK image from local Dockerfile
3. Install the HELK from local bash script
4. Exit

[HELK-INSTALLATION-INFO] Enter choice [ 1 - 4]
HELK Initial Settings
At the end of the HELK installation, you will have a similar output with the information you need to access the primary HELK components. Remember that the default username and password for the HELK are helk:hunting.
***********************************************************************************
** [HELK-INSTALLATION-INFO] YOUR HELK IS READY                                   **
** [HELK-INSTALLATION-INFO] USE THE FOLLOWING SETTINGS TO INTERACT WITH THE HELK **
***********************************************************************************

HELK KIBANA URL: http://192.168.1.243
HELK KIBANA USER: helk
HELK KIBANA PASSWORD: hunting
HELK JUPYTER CURRENT TOKEN: bf329433d64f735ae50dce73bab995bb240194a98b84bfd2
HELK SPARK UI: http://192.168.1.243:4040
HELK JUPYTER NOTEBOOK URI: http://192.168.1.243:8880
HELK DOCKER BASH ACCESS: sudo docker exec -ti helk bash

IT IS HUNTING SEASON!!!!!
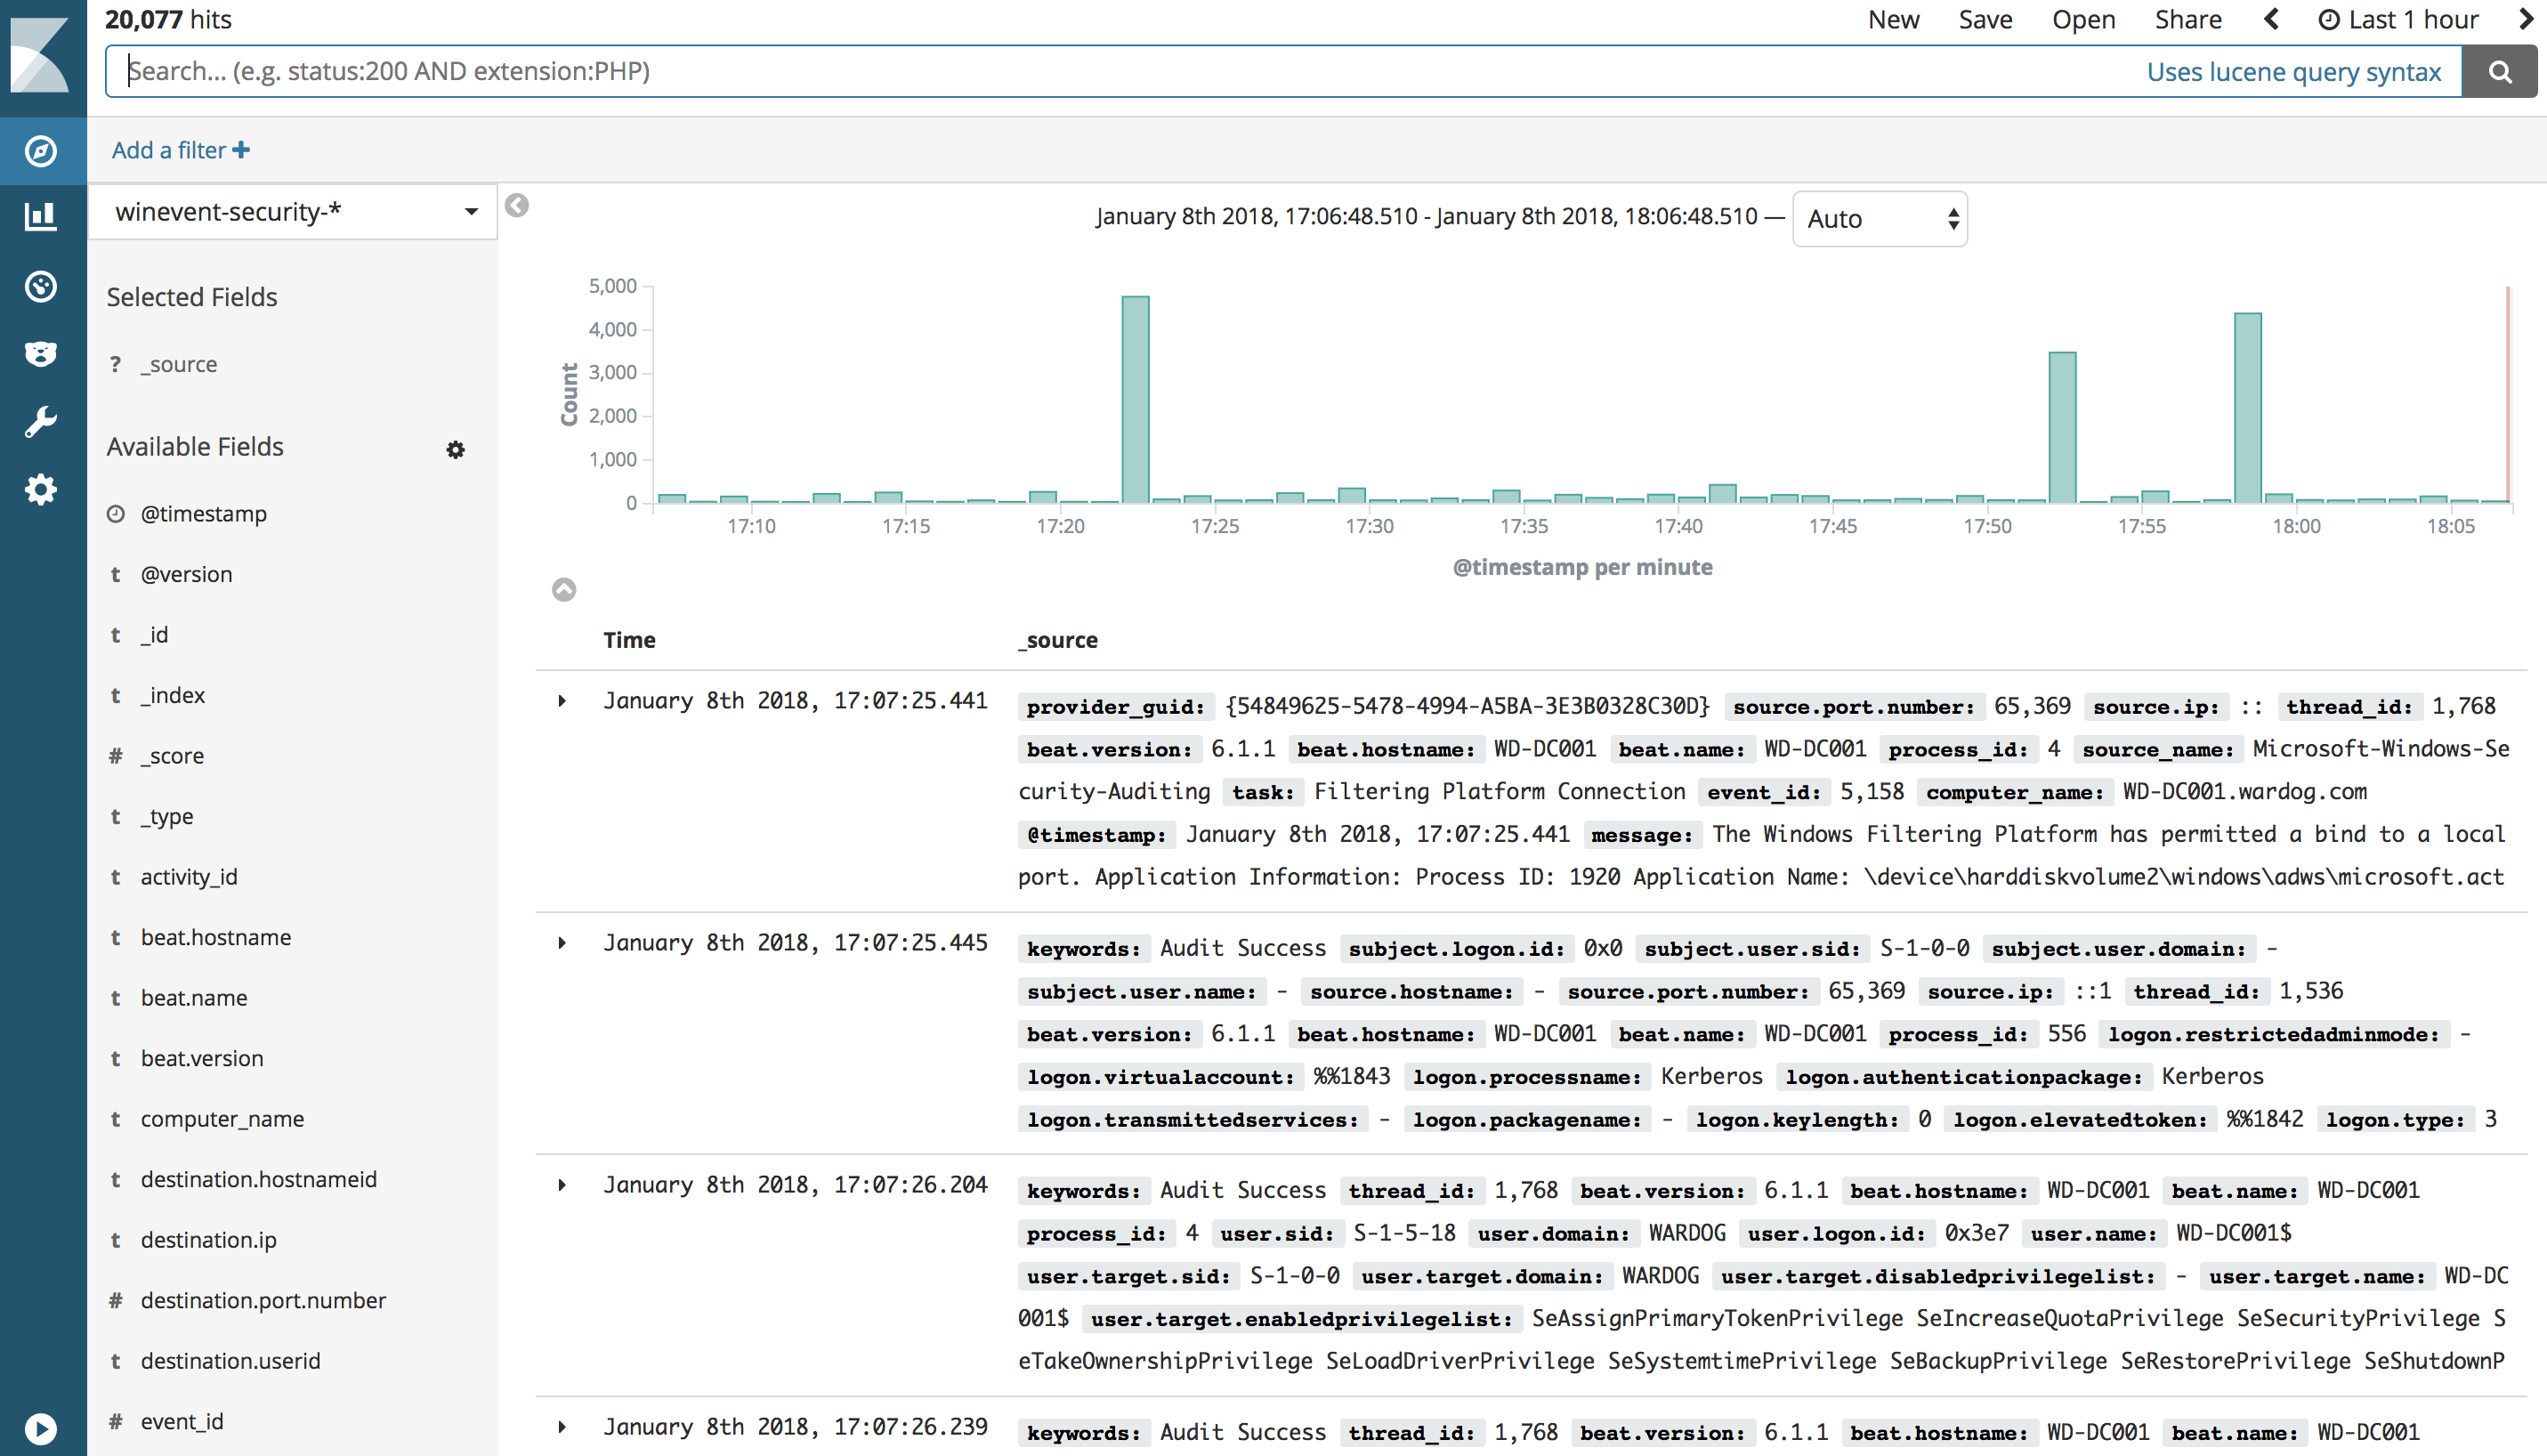
Visualize your logs (Discover)
Make sure you have logs being sent to your HELK first (At least Windows security events). Then, go to http://<HELK's IP> in your preferred browser. (If you dont have logs being sent to your HELK you will have to wait and repeat the first steps of this section) Currently, the HELK has 6 indices created automatically by its default configs:
- "*" - All
- "sysmon-*"
- "winevent-security-*"
- "winevent-application-*"
- "winevent-system-*"
- "powershell-*"
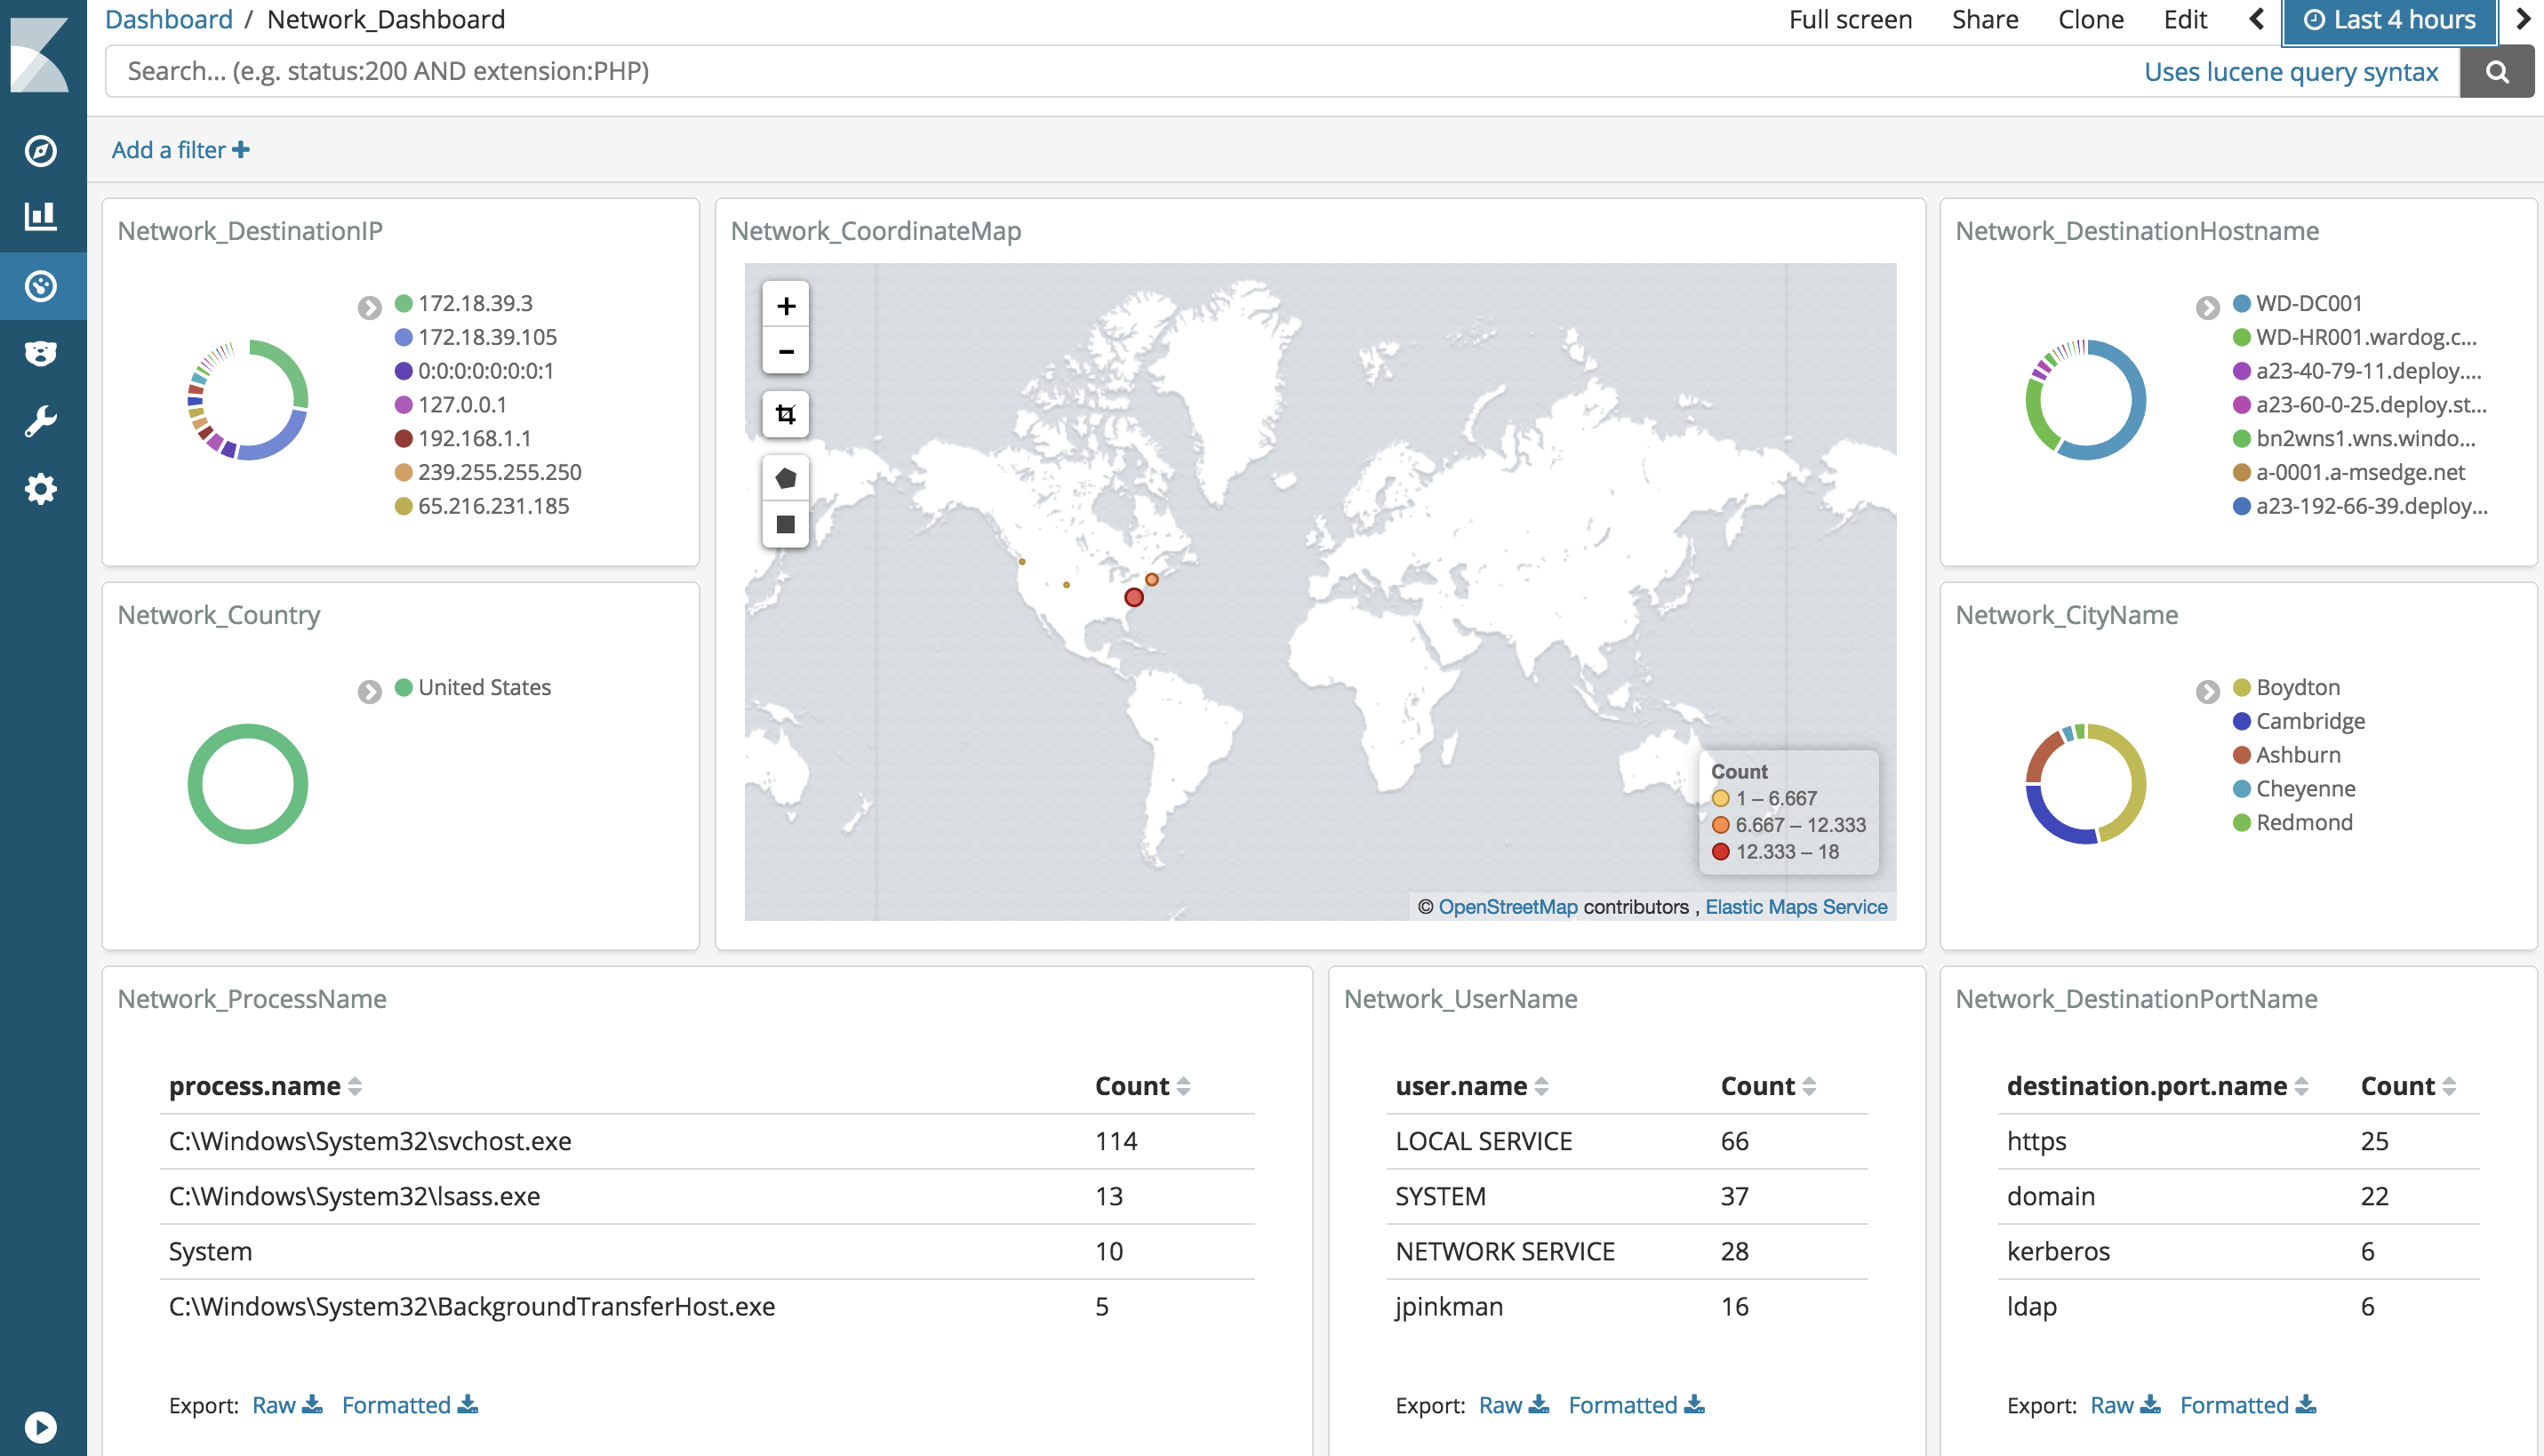
Visualize your logs (Dashboards)
Make sure you have logs being sent to your HELK first (At least Windows security events). Then, go to http://<HELK's IP> in your preferred browser. (If you dont have logs being sent to your HELK you will have to wait and repeat the first steps of this section) Currently, the HELK provides 3 dashboards:
- Global_Dashboard
- Network_Dashboard
- Sysmon_Dashboard
(Docker) Accessing the HELK's container
By default, the HELK's container is run in the background. Therefore, you will have to access your docker container by running the following commands:
sudo docker exec -ti helk bash
root@7a9d6443a4bf:/opt/helk/scripts#
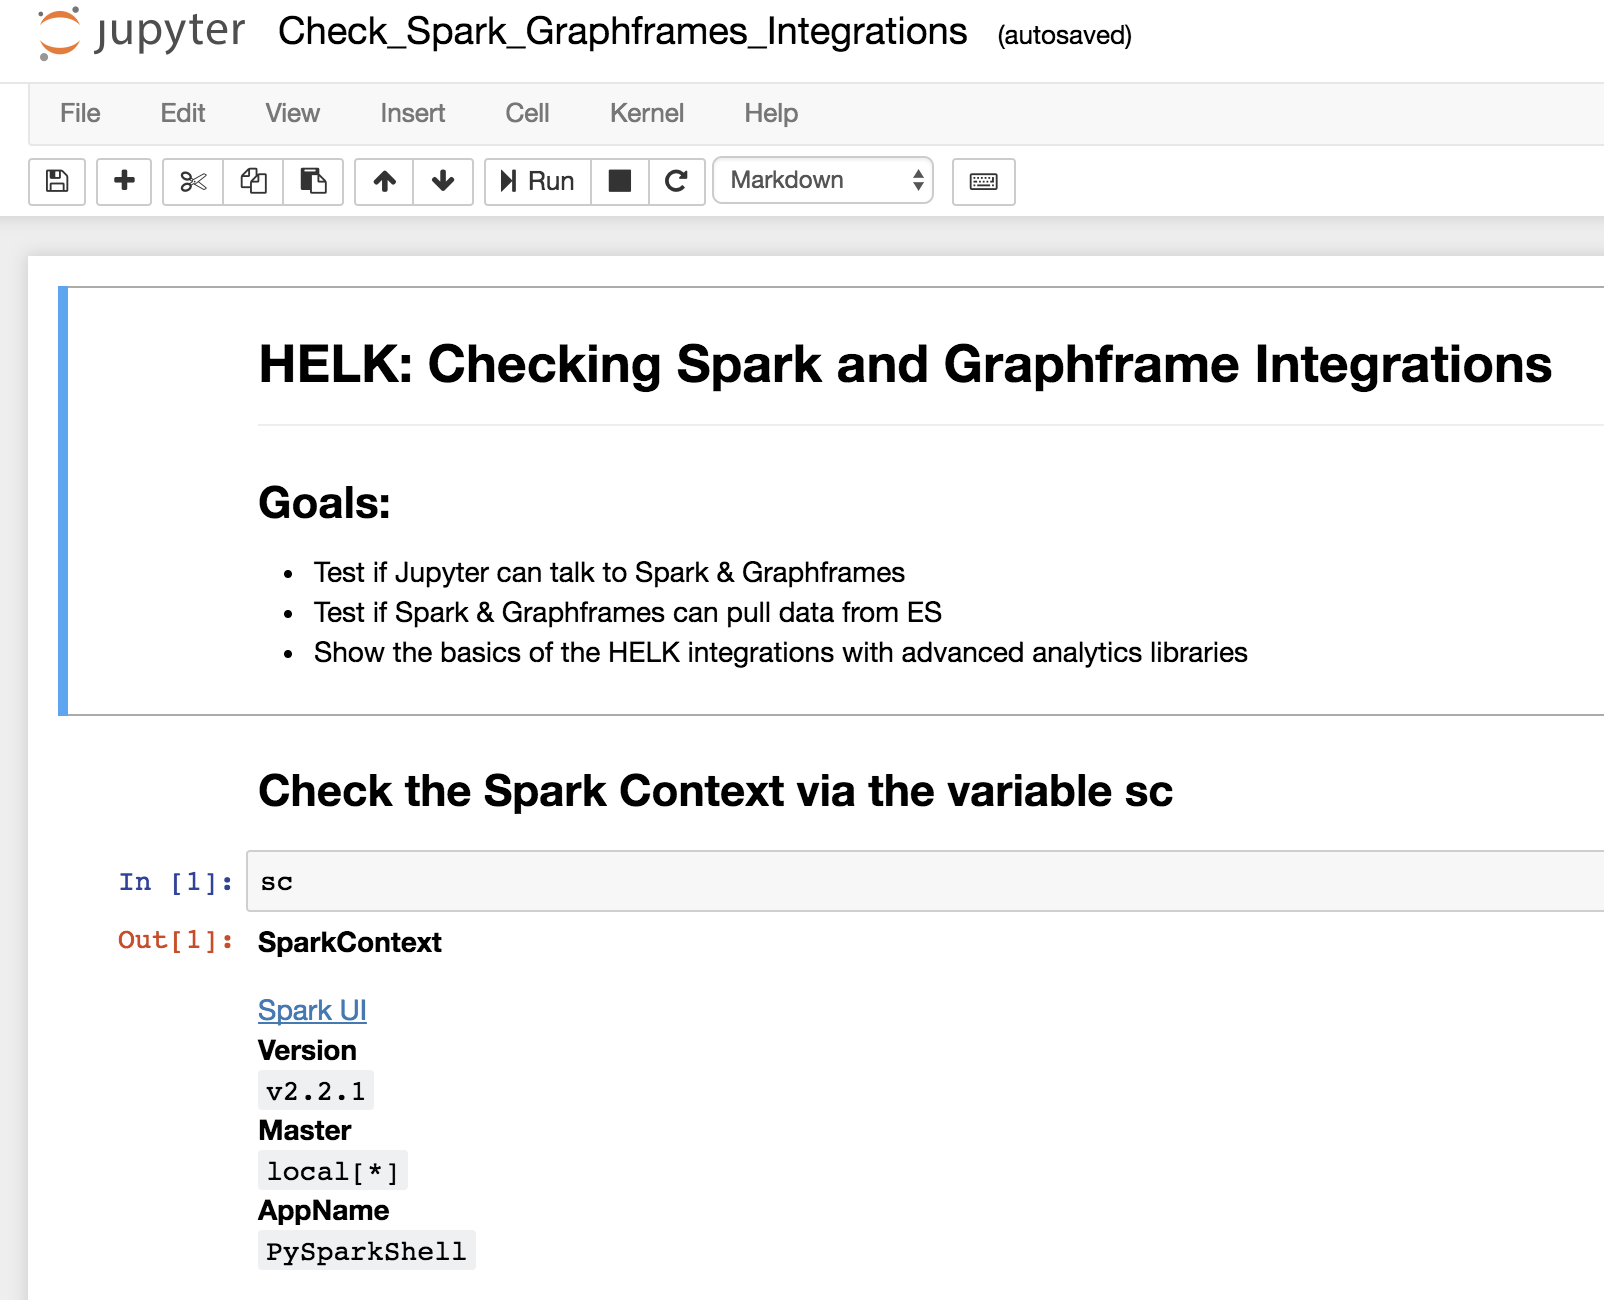
Checking HELK integrations (Spark, Graphframes & Jupyter)
- (Bash script Install) If the HELK was installed via the local bash script, make sure you enable the .bashrc file before starting the Jupyter server.
source ~/.bashrc && pyspark
- (Docker Install) By default, the Jupyter server gets started automatically after building or pulling the HELK's container.
- Access the Jupyter Server:
- Go to your <Container's IP>:8880 in your preferred browser
- Enter the token provided after installing the HELK
- Go to the scripts/training/jupyter_notebooks/getting_started/ folder
- Open the Check_Spark_Graphframes_Integrations notebook
- Check the saved output (Make sure that you have Sysmon * Windows Security event logs being sent to your HELK. Otherwise you will get errors in your Jupyter Notebook when trying to replicate the basic commands)
- Clear the output from the notebook and run everything again
HELK's Heap Size
By default, HELK calculates how much memory the host has and assigns 50% of it to it (You can change that by manually modifying the /etc/elasticsearch/jvm.options file after the installation and restarting your elasticsearch service)
sudo nano /etc/elasticsearch/jvm.options
sudo service elasticsearch restart
Troubleshooting the HELK:
HELK Installation Logs
- HELK Install Logs:
- /var/log/helk-install.log
- HELK Docker Logs:
sudo docker logs helk
HELK Application Logs
- Elasticsearch:
- /var/log/elasticsearch/elasticsearch.log
- Logstash:
- /var/log/logstash/logstash-plain.log
- Kibana:
- /var/log/kibana/kibana.stdout
- /var/log/kibana/kibana.stderr
Author
- Roberto Rodriguez @Cyb3rWard0g @THE_HELK
Contributors
- Robby Winchester @robwinchester3
- Nate Guagenti @neu5ron
- Jordan Potti @ok_bye_now
- esebese esebese
Contributing
There are a few things that I would like to accomplish with the HELK as shown in the To-Do list below. I would love to make the HELK a stable build for everyone in the community. If you are interested on making this build a more robust one and adding some cool features to it, PLEASE feel free to submit a pull request. #SharingIsCaring
TO-Do
- Upload basic Kibana Dashboards
- Integrate Spark & Graphframes
- Add Jupyter Notebook on the top of Spark
- Kafka Integration
- Create Jupyter Notebooks showing how to use Spark & GraphFrames
- Enhance elasticsearch configuration to make it more scalable
- MITRE ATT&CK mapping to logs or dashboards
- Cypher for Apache Spark Integration (Might have to switch from Jupyter to Zeppelin Notebook)
- Somehow integrate neo4j spark connectors with build
- Install Elastalert
- Create Elastalert rules
- Nxlog parsers (Logstash Filters)
- Add more network data sources (i.e Bro)
More coming soon...


